Data Analysis & Visualization Course in Bangalore
- Duration: 3 Months (12 Weeks)
- Mode: Online/Offline
- Certification: Industry Recognized
- Timings : 10AM - 7:30PM
-
Working Day: Monday - Saturday
- Every Course: 1hr session (60mins)
Rating : 4.4/5
Quick Enquiry
Overview of
Data Analysis & Visualisation with AI Training
Learn to make sense of data using modern tools and AI-powered techniques.
This course equips you with essential skills in data analysis using Excel, Google Sheets, Python, Power BI, and Tableau. You’ll go beyond spreadsheets to explore how Artificial Intelligence can uncover hidden patterns, automate insights, and enhance decision-making. Build dashboards, create visual stories, and apply AI tools to real-world datasets — all while mastering the end-to-end process of transforming raw data into clear, actionable outcomes.

Why People Love Us
At Scholar’sEdge Academy, we’ve earned the trust of our learners by focusing on what truly
matters real learning, real support, and real outcomes. Here’s why students choose us and recommend us:

We break down complex topics into easy-to-understand lessons, with a focus on doing not just listening. You’ll work on real projects that make sense and build your confidence.
Many of our learners start with little to no experience and that’s okay. Our courses are designed to guide you step by step, with no pressure and full support.
Our mentors are not just instructors they’re friendly, helpful professionals who guide you like a coach, answer your doubts, and push you to grow.
Whether you’re in college, working, or switching careers we give you the flexibility to learn at your pace, without deadlines or stress.
Learning a skill is just the first step. We also help you prepare for jobs from resume building and LinkedIn tips to mock interviews and soft skills.
No filler, no fluff. We teach only what’s useful in the real world tools, skills, and strategies that employers actually want.
Our pricing is designed for students and learners like you budget-friendly, but with high value. You’ll never feel like you’re overpaying.
Our learners have gone on to crack interviews, get internships, land jobs, or even start their own projects because we focus on building skills, not just certificates.
Want to Book Your Seat?
Weeks 1–4: Excel + Google Sheets
Weeks 5–8: Python for Data Analysis + Visualization
Weeks 9–12: Power BI + Tableau + Final Dashboard Project

Data Analysis & Visualisation with AI Syllabus (Beginner to Intermediate)
- Data Cleaning, Filters, Functions
- Pivot Tables, Charts, Dashboards
- AI Add-ons (e.g., ChatGPT for Sheets)
- Data Handling with Pandas
- Data Cleaning, Null Values, Sorting
- Visualizations with Matplotlib & Seaborn
- Importing Data, Creating Dashboards
- Filters, Slicers, Cards
- AI-Generated Insights
- Analyze a real dataset
- Build & present interactive dashboards
Excel, Google Sheets, Python, Power BI, Tableau, Colab
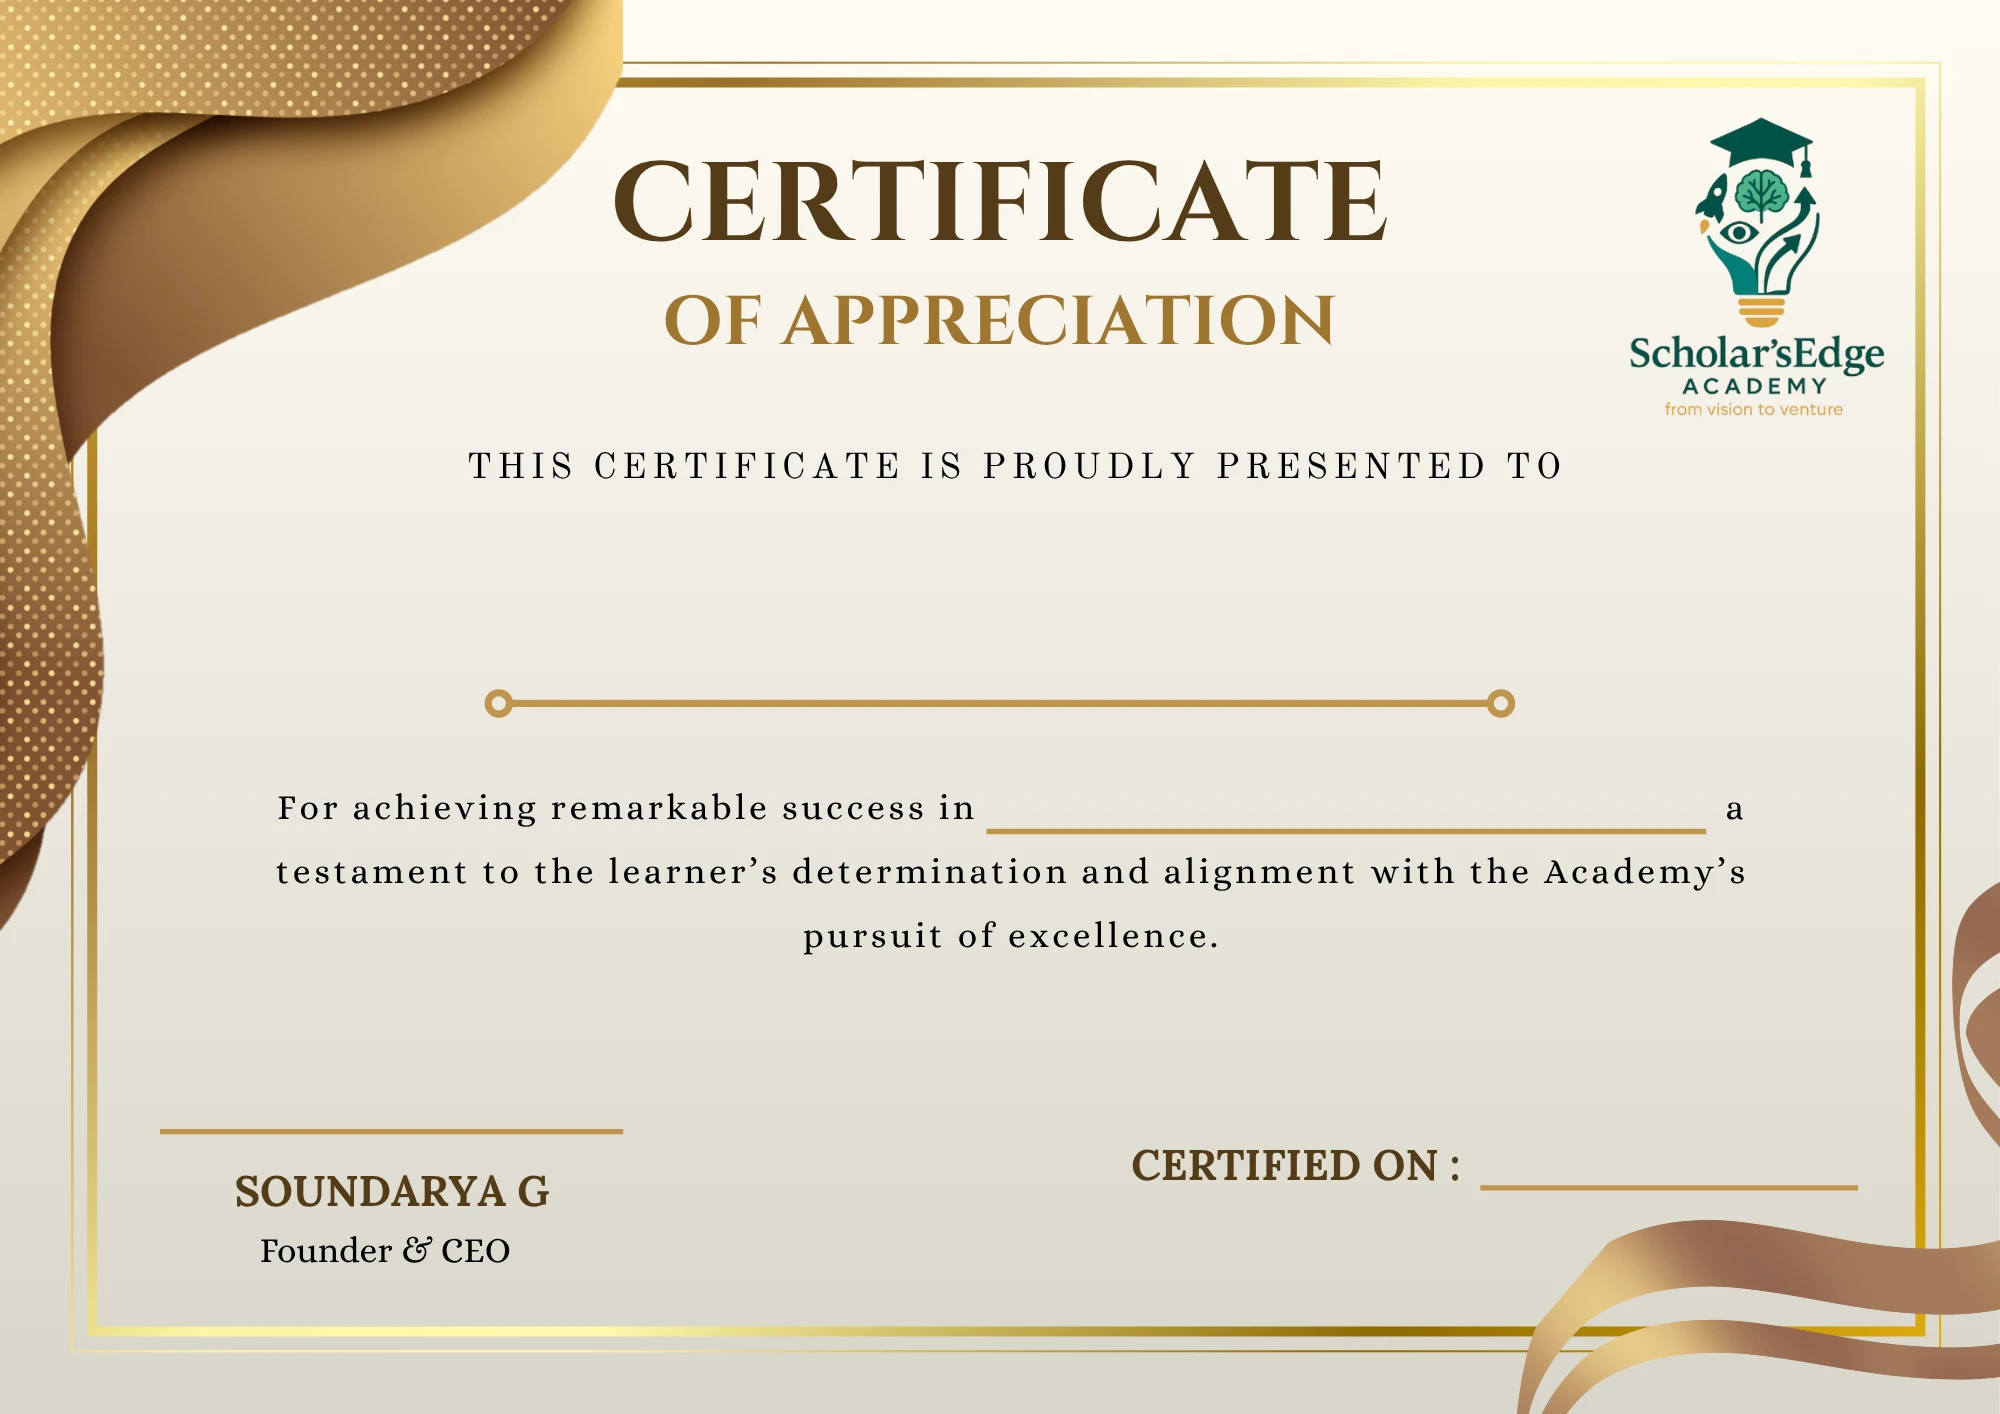
Scholar'sEdge ACADEMY Certification
At Scholar’sEdge Academy, a certificate isn’t just proof of completion it’s the beginning of your transformation. It’s your badge of discipline, curiosity, and drive. With every course, you don’t just learn you level up. Our verified certificates, uniquely numbered and digitally sharable, mark your growth and signal to the world: “I’m ready.”
What Our Certificate Represents:
- Verified Skill Mastery : Each certificate confirms your successful completion of a rigorous, industry-relevant course.
- Career-Boosting Recognition : Use your certificate to strengthen your CV, LinkedIn profile, and interview portfolio.
- Trusted by Employers : Backed by Scholar’sEdge Academy, our certificates reflect practical competence, not just attendance.
- Unique Certificate ID : Instantly verifiable by recruiters and institutions worldwide.

What's Our Students Think


Before joining Scholar’sEdge, I had zero coding experience. Now, I’m building real projects and even landed in freelancing. The teaching is practical, the support is constant, and the certificate helped boost my LinkedIn profile.
Aarav M,
Python Learner"I always wanted to explore design, but didn’t know where to start. This course broke it down step-by-step. The final project I made became part of my portfolio and I got my first internship offer within a month!
Yusuf K,
UI/UX Design StudentEnrolling in the Python + AI course changed my life. I went from knowing nothing about programming to building real AI projects. Within 2 months of finishing the course, I secured an internship at a startup. Scholar’sEdge helped me turn curiosity into confidence.
Sanjana V,
From Student to Intern (Python + AI)I was working in sales but wanted to move into tech. The Full Stack course at Scholar’sEdge was clear, structured, and beginner-friendly. I built a portfolio, and now I’m freelancing as a web developer. The best part? I did it while working full-time.
Fatima N,
Career Switcher to Full Stack DeveloperEvery module was packed with practical knowledge. From creating ads to building a personal brand, I walked away with real skills I use every day.
Harshini K,
Digital Marketing Learner


Grow You Skills To Advance Your Career Path
+
Experience Tutors

+
Enrolled Students

+
Qualified Courses


Frequently Asked Question
You’ll learn to clean, analyze, and visualize data using Excel, Power BI, and Python. You’ll also explore how to integrate AI tools to generate insights and automate reporting.
No, this course is beginner-friendly. You’ll start with the basics and gradually move to advanced concepts, including AI integration for smart analysis.
The course includes Excel, Power BI, Tableau, Python (with Pandas and Matplotlib), and AI tools like ChatGPT and Microsoft Copilot.
Yes, you’ll build dashboards, run data-driven case studies, and use AI to automate analysis. All projects are designed to boost your portfolio.
Graduates can work as Data Analysts, Business Intelligence Analysts, Reporting Analysts, or Data Visualization Experts — with an edge in AI-enhanced analytics.
Welcome to scholarsedge!
Hi there 👋
How can I help you?
WhatsApp Us
Online | Privacy policy
WhatsApp us

