
Quick answer: The Excel formulas every data analyst should know are XLOOKUP (or INDEX with MATCH), SUMIFS, COUNTIFS, AVERAGEIFS, IF with IFERROR, TRIM and the text functions, TEXTJOIN, date functions such as EOMONTH, and the dynamic array functions UNIQUE, FILTER and SORT. Add pivot tables and you can answer most everyday business questions in a spreadsheet.
Not sure where to start? Try a free demo class, online or at our J. P. Nagar centre. Book on WhatsApp
Excel is still the first tool most analysts open, because business data often arrives as a spreadsheet and a manager wants an answer today. You do not need hundreds of functions. A short list, used well, covers most of the work. This guide explains eleven formulas and tools, shows what each one is for, and tells you the mistakes that quietly give wrong numbers.
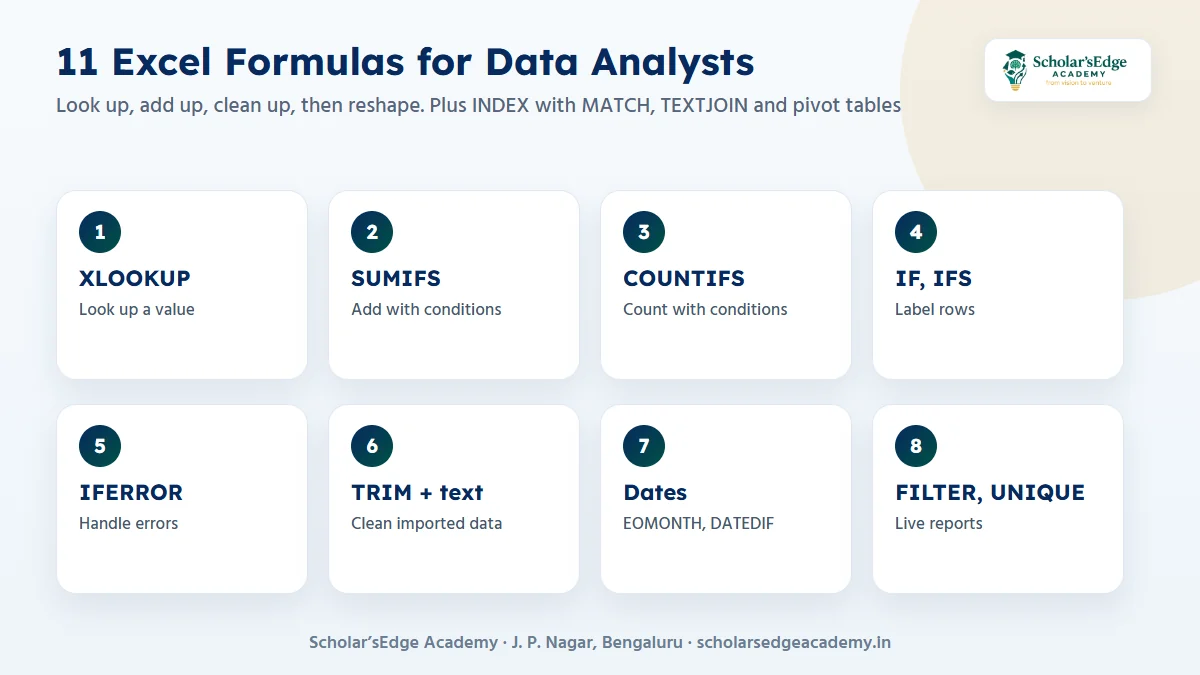
The 11 formulas and tools, grouped by the job they do
Learn them in this order: look things up, add things up, clean the text, handle errors, then reshape the data. Type each formula into a small practice sheet instead of only reading it.
| Formula | What it does | Use it when |
|---|---|---|
| XLOOKUP | Finds a value in one column and returns a match from another | You need a price, name or category from a lookup table |
| INDEX with MATCH | Looks up in any direction and works in older Excel versions | The file must open in Excel 2016 or 2019 |
| SUMIFS | Adds numbers that meet several conditions | Sales for one region in one month |
| COUNTIFS | Counts rows that meet several conditions | Orders above a value from one channel |
| AVERAGEIFS | Averages numbers that meet conditions | Average order value for new customers |
| IF, IFS | Returns one result or another based on a test | Labelling rows such as Low, Medium, High |
| IFERROR | Replaces an error with a value you choose | A lookup may not find a match |
| TRIM, LEFT, RIGHT, MID, TEXTJOIN | Cleans, slices and joins text | Imported data has extra spaces or joined codes |
| EOMONTH, DATEDIF | Moves to month end, counts days, months or years | Month-end reports and age or tenure |
| UNIQUE, FILTER, SORT | Return a live list of unique, filtered or sorted rows | A report that must update when data changes |
| Pivot table | Summarises thousands of rows by dragging fields | A first look at any new dataset |
- XLOOKUPWrite
=XLOOKUP(A2, Products[ID], Products[Price], "Not found"). It looks for A2 in the ID column and returns the matching price. Unlike VLOOKUP it can look left and does not break when you insert a column. - INDEX with MATCHWrite
=INDEX(Price, MATCH(A2, ID, 0)). MATCH finds the row number, INDEX returns the value at that row. The final 0 means exact match, and forgetting it is a classic error. - SUMIFSWrite
=SUMIFS(Sales, Region, "South", Month, "Oct"). The sum range comes first, then each range and its condition. Every range must be the same size. - COUNTIFS and AVERAGEIFSThese use the same pattern as SUMIFS.
=COUNTIFS(Channel, "Ads", Value, ">5000")counts matching rows. - IF and IFSWrite
=IF(B2>=100, "High", "Low"). IFS tests several conditions in order and returns the first that is true, so it replaces long nested IF formulas. - IFERRORWrap a formula that may fail:
=IFERROR(XLOOKUP(...), 0). Use it carefully, because it can also hide a real mistake. - TRIM and text functions
TRIMremoves extra spaces,LEFT,RIGHTandMIDcut text by position, andTEXTJOINjoins cells with a separator. Clean a column before you look anything up in it. - Date functions
EOMONTH(A2, 0)gives the last day of the month.DATEDIF(start, end, "M")returns whole months between two dates. - UNIQUE, FILTER, SORT
=SORT(UNIQUE(Region))returns a sorted list of regions.=FILTER(Table, Table[Status]="Open")returns only open rows. These need a version of Excel with dynamic arrays. - Pivot tablesSelect the data, insert a PivotTable, then drag Region to rows and Sales to values. Refresh it when the data changes.
Mistakes that give wrong numbers without an error
- Numbers stored as text. A column that looks numeric but is left-aligned will not add up. Convert it first.
- Hidden spaces. A value with a trailing space will not match its twin. Use TRIM before a lookup.
- Using approximate match by accident. Lookups should use exact match unless you are sorting values into bands.
After every formula, check one result by hand. If you cannot explain why a number is right, you do not yet know that it is.
A 7-day practice plan
- Days 1 and 2: SUMIFS, COUNTIFS and AVERAGEIFS on a sales sheet.
- Day 3: XLOOKUP and IFERROR against a product list.
- Day 4: clean a messy file with TRIM, LEFT, RIGHT and TEXTJOIN.
- Day 6: UNIQUE, FILTER and SORT for a live summary.
- Day 7: build one pivot table and write three sentences about what it shows.
Microsoft keeps an official list of every function with examples in its Excel functions reference. Use it whenever a formula behaves in a way you do not expect.
Where Excel fits in a data analyst career
Excel is the starting point, not the end. Once a dataset is too big or too shared for a spreadsheet, analysts move to SQL for querying, Power BI for dashboards and Python for heavier cleaning. The Data Analytics with AI course at our J. P. Nagar centre runs for 4 months: 3 hours a day, Monday to Friday, plus a Saturday case clinic, with a weekend batch also available. A 2-month internship is included for every enrolled student.
Next, read the data analyst roadmap and practise with our SQL interview questions.
Ready to try a class before you decide?Book a free demo class to see the syllabus, ask about fees and batches, and meet the team. Every course includes a 2-month internship, and classes run online and offline.Book on WhatsAppCall +91 99020 58603
Frequently asked questions
Which Excel formula should a beginner learn first?
Start with SUMIFS and XLOOKUP. Between them they answer many everyday questions about totals and lookups.
Is XLOOKUP better than VLOOKUP?
For most work, yes. XLOOKUP can return values from columns to the left, uses exact match by default and does not break when columns are inserted. It needs Microsoft 365 or Excel 2021 and later.
Do data analysts still use Excel?
Yes. Excel is widely used for quick analysis and sharing, alongside SQL, Power BI and Python for larger or repeated work.
How long does it take to learn these formulas?
With a few hours of practice a day, many learners can use the core formulas in a couple of weeks. Fluency comes from using them on real data.
Can a non-IT graduate learn Excel for data analysis?
Yes. Our Data Analytics with AI course is open to any graduate, including B.Com, BBA and BSc graduates, and starts from the basics.
Not sure yet? Talk to us
Book a free demo class or ask for 1:1 guidance on WhatsApp at +91 99020 58603, or use the form on our contact page. You can also compare all our courses. Scholar’sEdge Academy is at Building No. 19, 25/1, 9th Cross Road, 2nd Phase, J. P. Nagar, Bengaluru, Karnataka 560078. Read how we write and check our articles in our editorial policy.
