
Quick answer: Good Power BI projects for beginners are a retail sales dashboard, a marketing ROI report, a customer churn view, an HR headcount dashboard, a loan or credit risk summary and an e-commerce funnel. Each teaches data cleaning, a star-schema model, DAX measures and a clear one-page layout. Our Data Analytics with AI course builds three of these.
A Power BI portfolio shows employers you can turn raw data into decisions, which is the whole job of a data analyst. Tutorials teach tools, but projects teach judgement. This guide gives six beginner-friendly project ideas, the data you need for each, the visuals to build and the skills each one proves.
Six Power BI project ideas for beginners
Pick one project, finish it properly and publish it with a short write-up. Three polished dashboards beat ten half-finished ones.
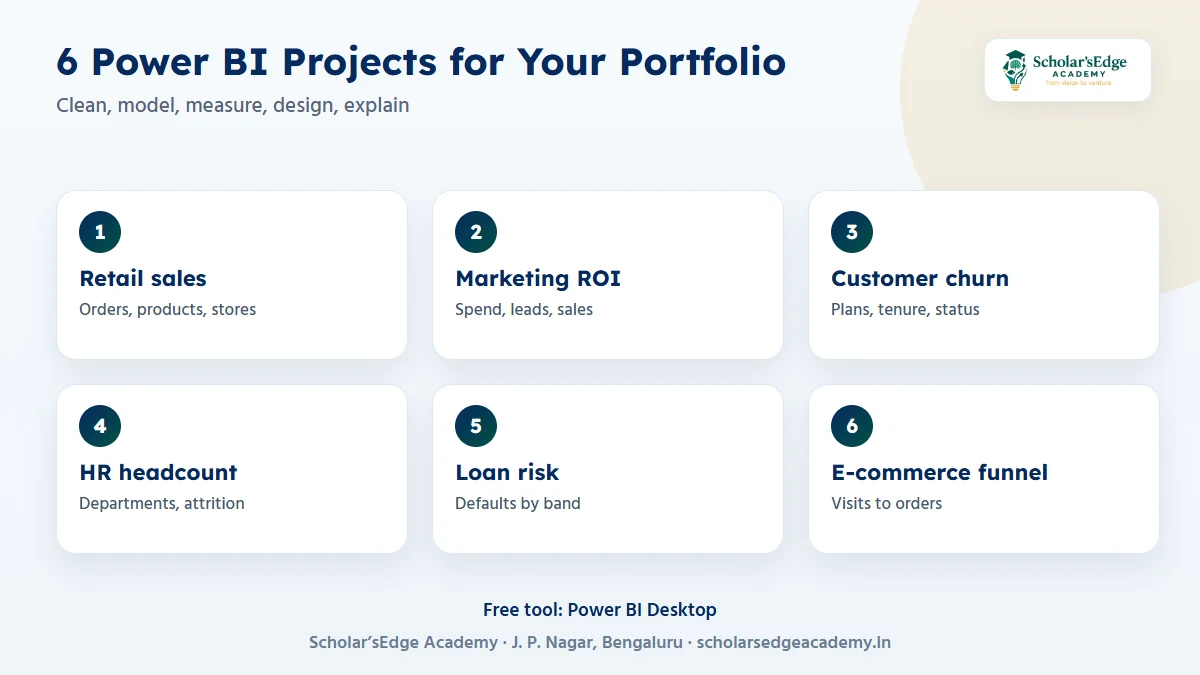
| Project | Data you need | Key visuals | Skill it proves |
|---|---|---|---|
| Retail sales dashboard | Orders, products, stores | Sales by month, top products, region map | Data model, DAX totals |
| Marketing ROI report | Ad spend, leads, sales by channel | Cost per lead, return by channel | Ratios, comparisons |
| Customer churn view | Customer, plan, tenure, status | Churn rate by segment | Segmentation, filters |
| HR headcount dashboard | Employees, department, joining dates | Headcount trend, attrition by team | Dates, time intelligence |
| Loan and credit risk summary | Loans, repayments, defaults | Default rate by band, exposure | Risk thinking, KPIs |
| E-commerce funnel | Visits, carts, orders | Funnel chart, drop-off by step | Storytelling with data |
You can build all six in the free Power BI Desktop. For practice data, look at the Open Government Data Platform India and public dataset sites such as Kaggle, and always check each dataset’s licence before you publish.
The same five steps for every project
- Ask one clear questionFor example: which products and regions drive our sales, and where are we losing them?
- Clean the dataFix data types, remove duplicates and handle missing values in Power Query before you build anything.
- Model it as a starKeep one fact table of events and small dimension tables for dates, products and customers, joined by relationships.
- Write DAX measuresCreate reusable measures such as Total Sales, Sales last month and Growth %, instead of columns.
- Design one clear pagePut the main number first, then two or three charts that answer the question, with simple slicers.
DAX measures to learn first
| Function | What it does | Typical use |
|---|---|---|
| SUM | Adds up a column | Total sales |
| DIVIDE | Divides and handles divide-by-zero safely | Conversion rate, margin % |
| CALCULATE | Changes the filter context of a measure | Sales for one region only |
| SAMEPERIODLASTYEAR | Shifts a date range back a year | Year-on-year growth |
Learn these four well before anything else. Most beginner dashboards need nothing more, and the Power BI documentation explains each with examples.
Mistakes that make a dashboard look amateur
- Too many visuals. If a page has more than six, the question is unclear.
- Charts without a title that states the point. Say what the viewer should notice.
- Columns instead of measures. Measures stay correct when someone filters the page.
- Unchecked numbers. Compare one total with the source data before you share it.
Write five lines under each project: the question, the data, what you found, the decision it supports and one thing you would improve. Recruiters read this before they open the file.
How our course covers Power BI projects
The Data Analytics with AI course runs for 4 months at our J. P. Nagar centre, with 3 hours of class a day from Monday to Friday plus a Saturday case clinic, and a weekend batch available. You learn Power BI with DAX, SQL, advanced Excel, Python with Pandas and AI tools for analysis.
- Projects: a retail sales dashboard, a credit-risk analysis, a marketing ROI and segmentation project, and a capstone presented to a panel.
- Alignment: the course is aligned to the Microsoft PL-300 Power BI Data Analyst exam. The exam is booked and taken separately with Microsoft.
- Internship and fee: a 2-month internship is included, and the offer fee is ₹20,999 (regular ₹29,999).
Also read the SQL interview questions for freshers.
Related guides: Power BI vs Tableau: Which Should a Beginner Learn First? and Data Analyst Roadmap 2026 for Freshers in Bangalore.
Ready to try a class before you decide?Book a free demo class to see the syllabus, ask about fees and batches, and meet the team. Every course includes a 2-month internship, and classes run online and offline.Book on WhatsApp
Frequently asked questions
Which Power BI project should a beginner start with?
Start with a retail sales dashboard. The data is easy to understand and it teaches modelling, DAX and layout.
Is Power BI free to learn?
Power BI Desktop is free to download from Microsoft. Publishing and sharing reports online needs a Power BI account and licence, so check Microsoft’s current terms.
How many projects do I need in my portfolio?
Three to four strong projects in different business areas is enough, each with a short written explanation.
Do I need to know SQL for Power BI?
It helps a lot. SQL pulls the data and Power BI presents it, which is why our course teaches both.
Can a fresher with a non-IT degree become a data analyst?
Yes. The Data Analytics with AI course is open to any graduate, including B.Com, BBA, BSc and BA Economics graduates.
Not sure yet? Talk to us
Book a free demo class or ask for 1:1 guidance on WhatsApp at +91 99020 58603, or use the form on our contact page. You can also compare all our courses. Scholar’sEdge Academy is at Building No. 19, 25/1, 9th Cross Road, 2nd Phase, J. P. Nagar, Bengaluru, Karnataka 560078. Read how we write and check our articles in our editorial policy.
