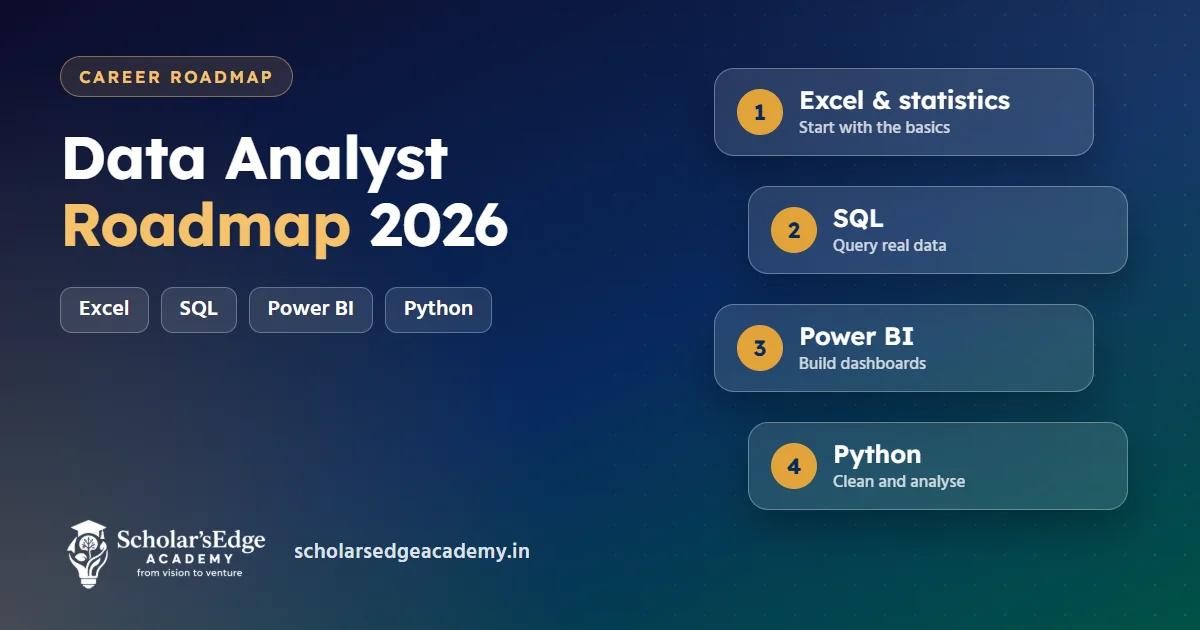
Quick answer: This data analyst roadmap runs in one order: Excel and basic statistics, SQL, a BI tool such as Power BI, then Python with Pandas, and finally portfolio projects. You can start from any degree. Our Data Analytics with AI course in Bangalore covers this path in 4 months, followed by a 2-month internship.
A data analyst turns raw business data into answers: which product sells, which customers leave, which campaign pays back. This roadmap shows the skills in the order that works best for freshers, what to practise at each step, and how long our course takes to cover it. It is written for students and working professionals in Bangalore who want a clear plan before they spend money or time.
The data analyst roadmap, step by step
The best order is Excel and statistics first, SQL second, Power BI third and Python fourth. Each skill builds on the one before it, so you can already do useful work after step two instead of waiting until the end.
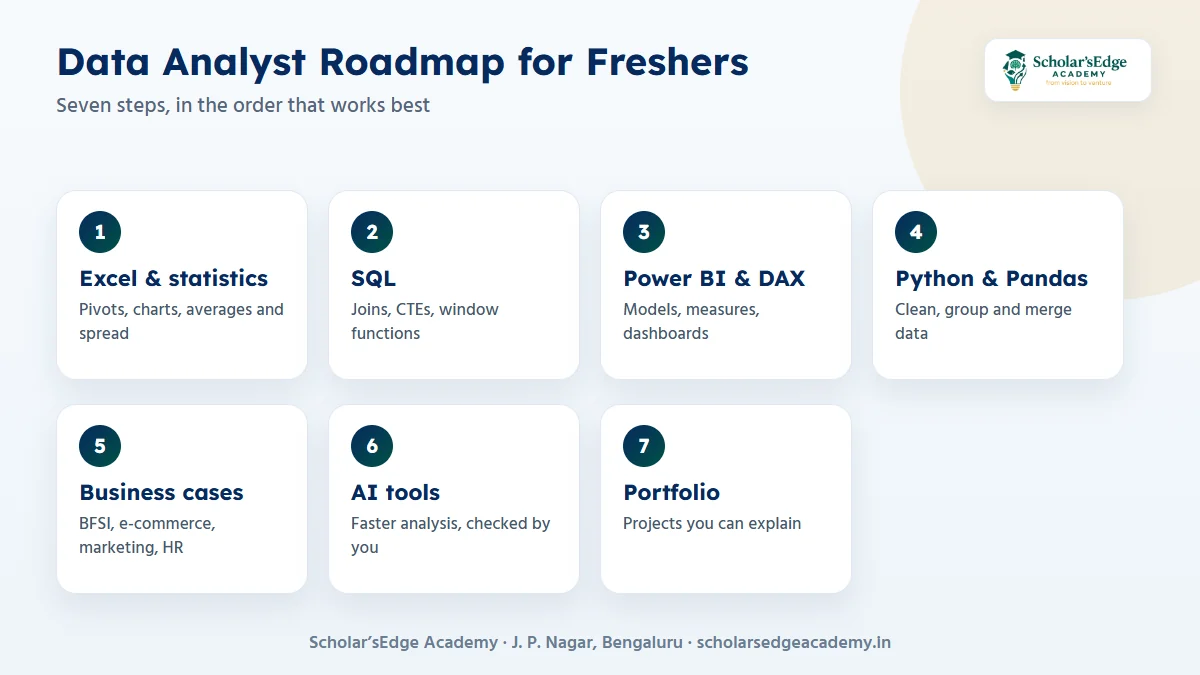
- Excel and statisticsFormulas, lookups, pivot tables, charts, then averages, spread, correlation and the idea behind hypothesis tests.
- SQLSELECT, WHERE, GROUP BY, joins, CTEs and window functions on real tables.
- Power BI and DAXModel data, write measures in DAX and build dashboards a manager can use.
- Python with PandasClean messy data, group, merge and chart it in code.
- Business casesPractise on BFSI, e-commerce, marketing and HR problems.
- AI tools for analysisUse AI to speed up analysis, reporting and natural-language-to-SQL, then check every result yourself.
- Portfolio and interviewsPublish three or four projects and practise explaining each one in plain words.
Which tool do you learn when?
Learn tools in the order below, and stay on each one until you can finish a small task without a tutorial. Depth in a few tools beats a shallow tour of many.
| Tool | What you use it for | When to learn it |
|---|---|---|
| Excel | Quick analysis, pivot tables, charts and checking numbers | Step 1 |
| SQL | Pulling and joining data from databases | Step 2 |
| Power BI with DAX | Dashboards, data models and reusable measures | Step 3 |
| Tableau | An alternative visualisation tool; the basics are enough to start | After Power BI |
| Python with Pandas | Cleaning, reshaping and analysing larger or messier data | Step 4 |
| AI tools | Drafting queries, summaries and reports faster | Alongside every step |
Not sure whether to pick Power BI or Tableau first? Read our comparison of Power BI vs Tableau.
Step 1: Excel and statistics
Start with Excel because every business already uses it. Learn lookups, pivot tables and charts, then the statistics behind them: mean, median, spread, correlation and what a sample can and cannot tell you.
- Build a monthly sales summary with a pivot table and a chart.
- Explain, in one sentence, why the average can mislead when a few values are very large.
Step 2: SQL, the skill most interviews test
SQL is how analysts get data out of a company database. Learn SELECT and WHERE, then GROUP BY and joins, and move on to CTEs and window functions, which are the topics that separate a strong candidate from an average one.
Practise on tables with customers, orders and products. After each query, say what business question it answered. The PostgreSQL documentation is a free, reliable reference for standard SQL.
Step 3: Power BI and DAX
Power BI turns your data into dashboards. Learn to import data, build relationships between tables, write basic DAX measures and design a page that answers one question clearly. The official Power BI documentation on Microsoft Learn is the best free reference.
Our course is aligned to the Microsoft PL-300 Power BI Data Analyst exam. The exam itself is booked and taken separately with Microsoft.
Step 4: Python with Pandas
Python helps when data is too large or too messy for Excel. Pandas is the library analysts use to load a file, fix missing values, group rows and combine tables. Read the official Pandas documentation alongside your practice.
Steps 5 to 7: cases, AI tools and a portfolio
Employers want proof that you can solve a business problem, not a list of tools. Build projects in one business area each, such as retail sales, credit risk or marketing return on spend, and write a short summary of the question, the method and the decision your analysis supports.
If a stranger can open your project, understand the question in one minute and see the answer on one dashboard page, it is ready to share.
Interview questions to practise
Analyst interviews usually test three things: can you write SQL, can you explain a dashboard, and can you reason about a business problem. Practise out loud, because explaining your thinking is half the interview.
- Write a query that returns the top five customers by revenue for each month.
- Explain the difference between a measure and a calculated column in Power BI.
- A sales dashboard shows a sudden drop. Which three things do you check first?
- When would you use a median instead of an average?
- Walk me through one project from the question to the decision it supported.
Common mistakes freshers make
- Collecting tools instead of skills. Knowing five tools shallowly is weaker than solving real problems with two.
- Skipping statistics. Without it, you can build a chart but cannot say whether a pattern is real.
- Copying tutorial projects. Change the question or the dataset so the work is yours.
- Not checking the data. Always look for duplicates, missing values and impossible numbers before you analyse.
How our course covers this roadmap
The Data Analytics with AI course at our J. P. Nagar centre runs for 4 months: 3 hours a day, Monday to Friday, plus a Saturday case clinic, with a weekend batch also available. You learn advanced Excel and statistics, SQL, Power BI with DAX, Tableau basics, Python with Pandas and AI tools for analysis and reporting.
- Projects: a retail sales dashboard, a credit-risk analysis, a marketing ROI and segmentation project, and a capstone presented to a panel.
- Who can join: any graduate (B.Com, BBA, BSc, BA Economics, engineering) and working professionals.
- Internship: 2 months, included for every enrolled student, with course and internship certificates.
- Classes: online and offline, so you can join from home or at our centre.
- Fee: offer price ₹20,999 (regular ₹29,999).
Curious how roles differ? Compare data analyst vs data engineer or data analyst vs data scientist, and see which companies hire data analysts in Bangalore.
Related guides: Excel Formulas Every Data Analyst Should Know, SQL Interview Questions for Freshers: Data Analyst Edition and Power BI Project Ideas for Beginners: 6 Dashboards to Build.
Ready to try a class before you decide?Book a free demo class to see the syllabus, ask about fees and batches, and meet the team. Every course includes a 2-month internship, and classes run online and offline.Book on WhatsApp
Frequently asked questions
Do I need coding to become a data analyst?
You need SQL, and Python helps as your work grows. You do not need a computer science degree, and our course teaches SQL and Python step by step.
Which should I learn first, SQL or Power BI?
Learn SQL first if you want to work with databases, and Power BI first if you want quick visual results. In our course the order is Excel, SQL, then Power BI, because dashboards are only as good as the data behind them.
Can a B.Com or BBA graduate become a data analyst?
Yes. Our Data Analytics with AI course is open to any graduate, including B.Com, BBA, BSc and BA Economics graduates, and to working professionals.
How long does it take to become job-ready?
It depends on how much you practise. Our course runs for 4 months with 3 hours of class a day, Monday to Friday, plus a Saturday case clinic, and then a 2-month internship.
Is the PL-300 exam included in the course?
The course is aligned to the Microsoft PL-300 (Power BI Data Analyst) exam. The exam itself is booked and taken separately with Microsoft.
Not sure yet? Talk to us
Book a free demo class or ask for 1:1 guidance on WhatsApp at +91 99020 58603, or use the form on our contact page. You can also compare all our courses and our combo courses. Scholar’sEdge Academy is at Building No. 19, 25/1, 9th Cross Road, 2nd Phase, J. P. Nagar, Bengaluru, Karnataka 560078. Read how we write and check our articles in our editorial policy.
